Top Business News- News18.com

Tuesday, October 11, 2016

The ease of SIP

Dreams can only be achieved if you work towards them. Even building wealth is no different. A Systematic Investment Plan (SIP) helps you do just that. SIP is a method of investing a fixed sum, regularly, in a mutual fund scheme. SIP allows one to buy units on a given date each month, so that one can implement a saving plan for themselves. The biggest advantage of SIP is that one need not time the market. Rather than timing the market, investing every month will ensure that one is invested at the high and the low, and make the best out of an opportunity that could be tough to predict in advance.

Benefits of investing with SIP:

    Disciplined approach to investments
    No need to time the market
    Harness the power of two powerful Investment strategies:
        Rupee Cost Averaging - Benefit from Volatility
        Power of Compounding - Small investments create Big Kitty over time
    Lighter on the wallet
    Reap benefits of starting early

Birla Sun Life Pure Value Fund: Strong long term SIP returns through Value Investing

Mutual Funds article in Advisorkhoj - Birla Sun Life Pure Value Fund: Strong long term SIP returns through Value Investing
Picture courtesy - PICJUMBO

We have discussed growth and value investing a number of times in our blog. For benefit of our readers who are not familiar with growth or value investing in mutual funds, let us briefly recap these two concepts.

    Growth Investment Style: In the growth investment style, the fund managers invest in companies that will experience faster growth in revenues, earnings per share (EPS) and share price. Growth stocks, even if they are perceived to be expensive, usually outperform the market in the near term.
    Value Investment Style: Value funds, on the other hand, invest in companies which are trading at a considerable discount to its intrinsic or fair valuation. The can be a number of reasons for these companies to be undervalued in the market and the valuations may remain depressed for a period of time, but in the long run these stocks can give outstanding returns.

The debate on growth versus value investing will continue, but in my opinion it really depends on the investment objectives and horizon of the investor. Over the last 3 years (April 2013 – April 2016), growth stocks in India, as represented by the MSCI Growth Index outperformed value stocks, as represented by MSCI Value Index. However, in the past one year (April 2015 – April 2016), in difficult market conditions, MSCI Value Index outperformed the MSCI Growth Index. Over a ten year period from April 2006 to April 2016, MSCI Value Index outperformed MSCI Growth Index.

Birla Sun Life Pure Value Fund, a midcap equity fund has delivered outstanding long term returns to investors by employing the value investing approach. If you had invested र 100,000 in the NFO of the scheme in March 2008, the value of your investment on May 1, 2016 would have been nearly र 400,000. The SIP returns of the fund have been simply outstanding. If you had started a monthly SIP of र 3,000 in the fund in April 1, 2008 the value of your investment today (May 1, 2016) would be more than र 7.2 lacs, while your cumulative investment over this period would have been less than र 3 lacs. A compounded annual SIP return of more than 21% is superlative, especially in light of the fact that, over the past 8 years, the Sensex has given only 6% annualized returns.
Fund Overview

Birla Sun Life Pure Value Fund was launched in March 2007. It has an AUM base of about र 430 crores. The relatively small AUM base, in fact, is an advantage for this fund because it primarily invests in stocks in the midcap segment. The expense ratio of the fund is a bit on the higher side at 2.9%. Mahesh Patil and Milind Bafna are the fund managers of this scheme. The fund has given more than 18% compounded annual returns since inception.

The chart below shows the trailing annualized returns of Birla Sun Life Pure Value Fund, midcap funds category and the benchmark BSE-200 index over different time-scales.

Wednesday, August 10, 2016


SWP returns of DSP BlackRock Balanced Fund have been very impressive

 
In our earlier posts on SWPs (Systematic withdrawal plan), we discussed how SWPs from Balanced Mutual Fund schemes could be a very good option for investors looking for regular returns from their investments post retirement etc. The fund we will analyze today is DSP BlackRock Balanced Fund which is one of the top performing balanced funds with a long term track record.
As we have discussed earlier Balanced Mutual Funds invests 65 – 75 % of the portfolio in equities and rest in debt or money market instruments. Balanced funds are subject to equity taxation as these are hybrid equity oriented mutual funds. Long term capital gains, on investments of more than 365 days and the dividends received from balanced funds are tax free. Short term capital gains applicable for investments of less than or upto 365 days are taxed at 15%.

What is Systematic Withdrawal Plan (SWP) in Mutual Funds

Systematic Withdrawal Plans or SWP, as popularly known, is a service offered by Asset Management companies in India (AMCs), which provides investors withdrawal of a specific amount at a pre determined time frequency or date – like, weekly, fortnightly, monthly, quarterly, half-yearly or annually.
If you can understand the benefits of this mechanism fully, then this could become the most effective and tax efficient way for you to earn regular returns from your Mutual fund investments in your retirement years.
Let us see some examples of top performing Balanced Funds.

How SWP worked in case of DSP BlackRock Balanced Fund
If you had invested र 10 Lacs in DSP BlackRock Balanced Fund – Regular Plan - Growth, 11 years back (01 August, 2005) and withdrawn र 8,000 per month after one year (02 August, 2006), then the current value of your investment would have been र 29.64 Lakhs even after withdrawing र 9.68 Lakhs over a period of 10 years!
Monthly SWP withdrawal of र 8,000 was assumed to have started after one year (starting 02 August, 2006) from the date of investment (01 August, 2005) and thereafter on the 2nd of every month so that each and every SWP amount in the hands of the investor is tax free!
The image below shows how we have selected the different options in our SWP Return Calculator to get this result. You can also explore this research tool to explore SWP returns of any fund of your choice.


Source: Advisorkhoj SWP Calculator – DSP BlackRock Balanced Fund Regular Growth (Data as on 08/08/2016)

SWP results of DSP BlackRock Balanced Fund – Regular Plan - Growth
From the above chart you can see that you would have withdrawn a total of र 9.68 Lakhs through 121 equal monthly SWP instalments of र 8,000 each, thus, you would have got a tax free return of 9.6% every year. Even after withdrawing a tax free amount of र 9.68 Lakhs over 10 years, the current value of your investment would be र 29.64 Lakhs! The return of this fund is annualised (IRR) 16.18%. You may Download the cash flow in excel and check
How to tackle inflation through SWP?
Yes, you can beat the inflation by increasing your SWP amount by a certain percentage every year! For example (see the chart below) – here, we have increased the SWP amount by 5% annually. Let us now see the results –
 Source: Advisorkhoj SWP Calculator with Annual increase (Data as on 08/08/2016)
From the above image, you can see that the investor would have withdrawn a total of र 11.88 Lakhs through 121 increasing SWP instalments, starting from Rs. 8,000 per month in the first year and ending with र 12,000 per month in the last year. Therefore, he would have got a tax free return of 9.6% in the first year which gradually increased every year and in the last year it was whopping 14.40%. Even after withdrawing a tax free amount of र 11.88 Lakhs, the current value of his investment would be र 26.07 Lakhs! The fund gave an annualised (IRR) 16.23% return. Please check the details here
Let us now see how the SWP amount increased over a period of time, the increasing annual withdrawal % on the lumpsum amount and how the value of net investments changed annually post these systematic withdrawals.


As you can see from the above image, how we have increased the SWP amount annually by 5% on the initial investment. You will also notice that during this entire period, the net investment value never dropped from the initial lumpsum investment amount i.e. र 10.00 Lakhs. It proves that if you remain invested over long period in balanced funds then the trailing returns should be positive.
DSP BlackRock Balanced Fund vs Valueresearch Hybrid Equity Oriented index
Now let us see the annual returns of DSP BlackRock Balanced Fund – Regular Plan - Growth against VR hybrid Equity Oriented index

Source: ValueExpress Analytics
You will notice that during the last 11 years, DSP BlackRock Balanced Fund – Regular Plan - Growth has beaten the VR-Hybrid Equity Index in most of the years excepting in 2008, 2011 and 2013 when the markets returns were extremely volatile.
About DSP BlackRock Balanced Fund
DSP BlackRock Balanced Fund is a hybrid equity oriented fund, popularly known as balanced funds. Launched in May 1999, it is a popular fund in the Balanced Fund category from one of India’s top AMCs, DSP BlackRock Mutual Fund. The fund has an AUM of र 1,226 Crores (As on June 30, 2016). It is one of the best performing Balanced Funds in the industry with a long term track record of 17 years! The fund is jointly managed by Atul Bhole, Pankaj Sharma and Vikram Chopra.
The top 5 stocks that the fund is invested in, are – HDFC Bank, Yes Bank, Ultratech Cement, SBI and BPCL. Financial, Chemical and Automobiles are the 3 top sectors that the fund is bullish on.
Lumpsum returns of DSP BlackRock Balanced Fund – Regular - Growth
So far we discussed the SWP returns of DSP BlackRock Balanced Fund – Regular - Growth and found how amazing the results were. Let us now also examine the lumpsum returns of this fund.
Had you invested र 10 Lacs in this fund 11 years back on 01 August, 2005 then your investment would have grown by almost 5 times! The current fund value would have been र 49.73 Lakhs, a CAGR return of 15.65%. For the same period, if this amount was invested in fixed deposit then you would have got only र 23.14 Lakhs, a whopping difference of र 26.59 Lakhs!
Please check the returns here – Lumpsum returns of DSP BlackRock Balanced Fund
SIP Returns of DSP BlackRock Balanced Fund – Regular - Growth
Let us know check the SIP returns of this fund. DSP BlackRock Balanced Fund – Regular - Growth SIP returns has also been very good! If you had started a monthly SIP of र 5,000 on 01 August, 2005, then you would have accumulated a corpus of र 14.89 Lakhs (based on NAV of 09 August, 2016), against your total investment of only र 6.65 Lakhs through 133 instalments. During this period the fund has given XIRR return of 13.93% and beaten the SIP returns of CNX NIFTY.
If you had started a SIP of र 5,000 in CNX Nifty during the same period then the current value would have been only र 11.65 Lakhs only with a return of only 9.83% only. Check out SIP Return Calculator

Source: Advisorkhoj SIP Calculator

Please also note that while doing an analysis of SIP returns of balanced funds, we found that, in the long run the SIP returns of balanced funds are comparable to the SIP returns of large cap funds – How SIPs in top balanced funds have created as much wealth as large cap funds
Conclusion
DSP BlackRock Balanced Fund – Regular - Growth gave very good SWP returns over the last 10 years or so and may be a good choice for investors looking for regular income from their lumpsum investments in post retirement period by taking moderate risk. However, investors should note that the past performances of mutual funds are no guarantees for future returns. Mutual fund investments are also subject to market risk and therefore investors must consult their financial advisors and check if investment in DSP BlackRock Balanced Fund is suited for their investment needs based on their risk profile.
Readers interested in knowing more about SWP, may read the following contents –
Mutual Funds are ideal investment option for retirement planning
Mutual Fund systematic withdrawal plans are smart option for income needs
Would you like to read some more SWP fund reviews, please check SWP reviews of ICICI Prudential Balanced Fund, Reliance Regular Savings Fund Balanced option, Birla Sun Life Balanced 95 Fund and SBI Magnum Balanced Fund.
                                                                            -Aug 10, 2016 by Pradip Chakrabarty

Mutual Fund Investments are subject to market risk, read all scheme related documents carefully.

Friday, July 29, 2016

Comparing mutual fund returns with fixed deposit returns in bull and bear markets


When it comes to mutual funds or equity investing, various perceptions are usually at play in the minds of the investors. Share markets are speculative. They can give good returns, but the investor can also lose a lot of money. As such, most investors in India prefer the safety of fixed deposits, which guarantees capital protection along with assured returns. While it is true that equities oriented mutual funds are riskier than fixed deposits, equity market professionals argue that equities provide much higher returns than fixed deposits in the long term. But many investors are still not impressed with that argument. Ask the investors who lost a huge portion of their equity investment in 2008. Investors are seen to be more biased to the avoidance of negative experiences. In psychological term, this is known as negativity bias, by which we recall bad memories more easily and in greater detail than good ones.

This negative perception of risk associated with equity markets, still seems to be ruling the minds of average Indian retail investor despite the recent bullishness in the market. In this article, we will not go into perceptions regarding equity markets. Rather we will objectively look at returns given by mutual funds and fixed deposits, over the last 10 year period across different market cycles, both bull markets and bear markets. Investors can see for themselves, to what extent is their perception aligned with reality.

In the last 10 years we have gone through a long bull market from 2002 to 2007, recently again over the past year or so, and intermittent periods in between. However, during this period we also went through one of the worst recessions in 2008 and then again in 2011. By analyzing returns across both bull and bear market cycles investors can evaluate for themselves the risk return trade off for equity funds versus fixed deposits. It is important to note here that mutual funds are essentially long term investments. For our analysis, we have assumed that the investment time horizon in mutual funds is 5 years. We will examine the returns given by mutual funds over 5 years versus fixed deposit returns, for the period from 2002 to 2013 which included both bull and bear market periods.

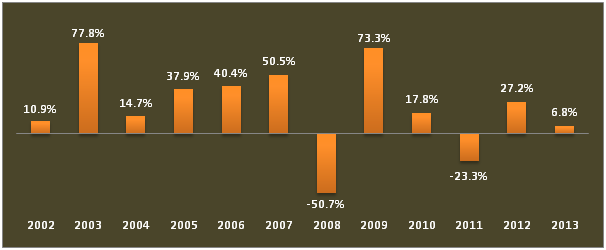
For our equity investment, we have taken an average large cap equity fund. For our fixed deposits, we have taken the average interest rates offered by different banks over the last 10 years. The point to note here is that the difference between the highest and lowest fixed deposit rate offered by different banks is not all that much, but the difference in the returns between top performing funds and the category average was easily 5 – 6%, if not more. But we have decided to stick with large cap category average, lest are we accused of equity bias. The chart below shows the average category returns for large cap funds since 2002.

Therefore as per the chart, above if an investor invested Rs 10,000 in an average large cap fund at the end of 2001 and redeemed his units after 5 years at the end of 2006, his investment would have grown to Rs 43,788. Similarly, if the investor invested Rs 10,000 in a large cap fund at the end of 2002 and redeemed his units after 5 years at the end of 2007, his investment would have grown to Rs 59,484. Long term capital gains in equity funds are tax exempt. Therefore the investor would not have to pay any tax on his returns.

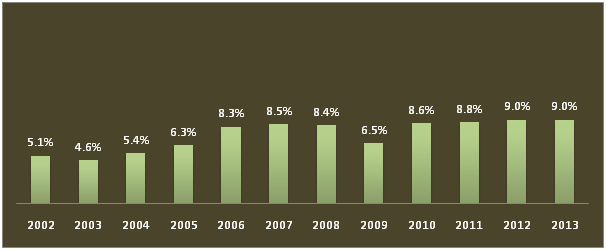
Now let us look at the average fixed deposit interest rates over the last 10 year period. The 1 to 3 year term rate is usually the highest fixed deposit rate. The rates for longer terms, e.g. 3 to 5 years and above are usually lower.

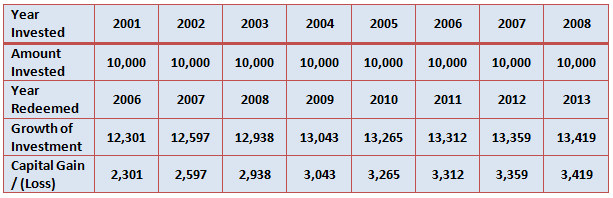
For the fixed deposit investment, we have assumed that the investor does a term deposit of 1 year (which usually has the highest interest rate) and renews it every year at the new rate. Since fixed deposit rates have been usually increasing year on year over this period, except a couple of years, this strategy would have worked best for the fixed deposit investor. If the investor invested Rs 10,000 in an FD at the end of 2001 and renewed it every year for 5 years, his principal and interest would amount to Rs 13,300 at the end of 2006. Fixed deposit interest is taxed as per the income tax slab rate of the investor. Assuming the investor is at the highest slab rate, the tax will be Rs 1,029. Therefore the post tax amount received by the investor would be Rs 12,301. Similarly, if the investor invested Rs 10,000 in an FD at the end of 2002 with annual renewal for 5 years, his post tax amount at the end of 2007 will be Rs 12,597.

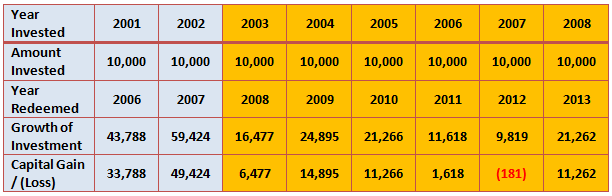
As you can see, mutual fund returns beat fixed deposit interest by a wide margin in the bull market years, But what happened in the bear market years? The table below shows 5 year growth of Rs 10,000 investment, made at the end of various years from 2001 to 2008.

All investments made after 2003 (shaded in amber in the table above) had to go through bear markets of either 2008 or 2011 or both. Now, please take a look at the line “Capital Gain / (Loss). Investors with a five year horizon did not make a loss in the above example, except the investment made in the 2007 to 2012 time horizon. Even the investment made in the 2007 to 2012 time horizon, probably worst years of the financial crisis in the last 50 years, lost less than 2%, only Rs 181 loss on the Rs 10,000 investment. It is here, that we should revisit risk perception. There is no denying that equities are risky. But if you have a long time horizon, your investment can recover from the negative impact of a bear market and give you good returns. The table above shows that in the most of the periods the investors doubled their investment tax free despite the severe bear market.

Now let us look at Fixed Deposit post tax returns. The table below shows 5 year growth of Rs 10,000 investment, made at the end of various years from 2001 to 2008.

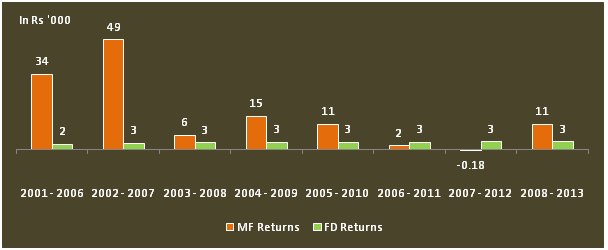
Let us compare the fixed deposit returns with the mutual fund returns. See the chart below, for the mutual fund returns versus fixed deposit returns over different 5 year time horizon over the last 10 years.

The chart above shows that while fixed deposits assure capital safety and guaranteed returns, mutual funds over a sufficiently long horizon have given much higher returns. Mutual fund returns are much higher in the 5 year time horizons starting 2002 to 2006. In the 2006 – 2011 and 2007 – 2012 time horizons, fixed deposits have given higher returns, no doubt as a result of the severe market downturns in 2008 and 2011. Again starting 2009, mutual funds have started to give better returns. When evaluating risk return trade off between mutual funds and fixed deposits, investors should compare their returns over sufficiently long period comprising of both bull markets and bear markets, as discussed above. The investment horizon is also of vital importance in determining the risk return trade off. It suffices to say that, if the investment horizon in our example was short, say 1 to 2 years, mutual funds would have had more periods of under performance.

Conclusion:In conclusion, we will go back to risk perception. Ultimately, the investor’s perception of risk influences his or her risk appetite. As discussed in our article, Measuring Risk Tolerance of Investors, the investment decision of the investor should be governed by his or her risk tolerance and not risk appetite. However, when it comes to actual decision making, one cannot wish away the influence of the investor’s perception of equity markets on their decision making. In this article, we have shown that if the investor remains invested for a sufficiently long time horizon, equity funds can give good returns despite difficult market conditions.

How Mutual Fund SIPs have created wealth over the last 15 years: Large Cap and Diversified Equity


Systematic Investment Plans (SIPs) were introduced in India almost 20 years back by Franklin Templeton. Since then, SIPs in good funds have generated excellent returns and created wealth for the investors. SIPs offer a simple and disciplined way to accumulate wealth over the long term. Mutual Fund SIPs work pretty much like bank recurring deposits, except they generate superior risk adjusted returns compared to recurring deposits. There are a number of benefits of retirement planning through Mutual funds Systematic Investment Plans (SIP):-
The biggest advantage of SIPs is that, they make the need to time the market irrelevant. It is not possible to predict accurately how markets will behave. By investing at a regular frequency, e.g. monthly, one is invested both at the high and the low points of the market. SIPs work well in volatile markets, by averaging the cost of the investment.

SIPs engender a disciplined approach to investing. By investing a fixed amount out of regular your savings, you will be able to build a corpus for your long term financial needs. Money not invested often gets spent on things that you may not need.

Mutual Funds are very flexible instruments. There are no restrictions and penalties on regular SIP payments and withdrawals, unlike PPF or ULIPs. You can start a SIP with a monthly investment, as low as Rs 500. Some mutual funds have even lower minimum investment limit.

For the smart investor, mutual funds offer more choices and transparency. You can select products based on your risk profile, track record, and fund objectives.

Equity oriented mutual funds are more tax efficient than most other investment products. Long term capital gains for equity mutual funds are tax exempt. Most debt investments, with the exception of public provident fund, are taxable.

In this series of articles, we will look at how SIPs have created long term wealth for the investors in the last 15 years. In this article, we will discuss how SIPs in some large cap and diversified equity fund, have created wealth for their investors. For our discussion, we have selected 7 large cap and diversified equity funds that have given good returns in the last 15 years. This is, by no means, a comprehensive list of all the funds that gave good returns in the last 15 years. This just an illustration of how long term investments in SIPs, have created wealth for investors. Each of the funds in our selection has given SIP returns of nearly 20% annualized. Since SIP investments are made over a period of time, the method of calculating SIP returns is different from that of Lump Sum investments. SIP returns are calculated by a methodology called XIRR, which is a variant of Internal Rate of Return (IRR). XIRR is similar to IRR, except XIRR can calculate returns on investments that are not necessarily strictly periodic.

For our examples, we have assumed a monthly SIP of Rs 3000 only, made on first working day of every month in the funds that we will discuss. Let us assume the SIP start date was 15 years back in May 1999. Over this period, the investor would have invested Rs 5.43 lakhs in SIPs of the following mutual funds. Let us see how much wealth would they have accumulated, by investing in the following funds.

ICICI Prudential Top 100 Fund: Within the ICICI Prudential stable, ICICI Prudential Dynamic Plan gave the highest annualized returns among all large cap and diversified equity funds in the last 10 years. But this fund has not yet completed 15 years, and so we were not able to select this fund. However, the ICICI Prudential Top 100 fund, a large cap fund launched in 1998, has also given excellent returns over the last 15 year period. The fund has an AUM base of nearly Rs 450 crores and is managed by Sankaran Naren. The chart below shows the SIP returns of the ICICI Prudential Top 100 fund, growth option, over the last 15 years.
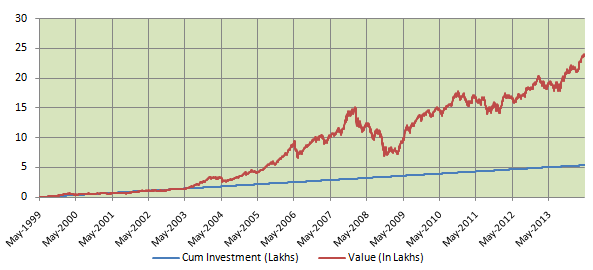
If you had started a monthly SIP of Rs 3000 in ICICI Prudential Top 100 fund back in May 1999, by now you would have accumulated nearly Rs 24 lakhs corpus, with an investment of only Rs 5.4 lakhs. You would have accumulated corpus of Rs 10 lakhs by the end of 2006, a corpus of Rs 15 lakhs by the end of 2007 and despite the severe financial crisis, a corpus of Rs 20 lakhs by the end of 2012. Over the 15 year period the compounded annual returns on your SIP investment in this fund would be 17.8%.

SBI Magnum Multiplier Plus
Fund: The SBI Magnum Multiplier Plus, a diversified equity fund was launched in 1993. The fund has an AUM base of over Rs 1000 crores and is managed by Jayesh Shroff. The chart below shows the SIP returns of the SBI Magnum Multiplier Plus fund, growth option, over the last 15 years.
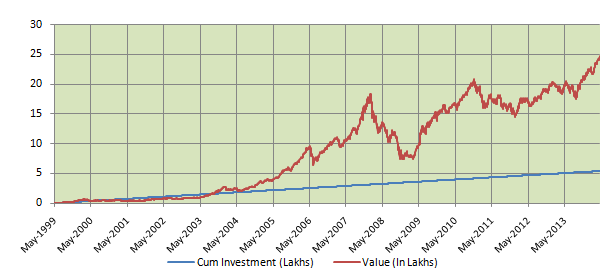
If you had started a monthly SIP of Rs 3000 only in SBI Magnum Multiplier Plus fund back in May 1999, by now you would have accumulated a corpus of over Rs 24 lakhs, with an investment of only Rs 5.4 lakhs. You would have accumulated corpus of Rs 10 lakhs by the end of 2006, a corpus of Rs 15 lakhs by the end of 2007 and a corpus of Rs 20 lakhs by the end of 2010. Over the 15 year period the compounded annual returns on your SIP investment in this fund would be 18.1%.

Franklin India Bluechip Fund: The Franklin India Bluechip fund, a large cap fund launched in 1993, has for long been a favourite with investors. The fund, proclaimed by many financial planning experts as one of the best ever mutual funds, its current relative under performance notwithstanding, has an AUM base of nearly Rs 4000 crores and is managed by Anand Radhakrishnan. The chart below shows the SIP returns of the Franklin India Bluechip fund, growth option, over the last 15 years.
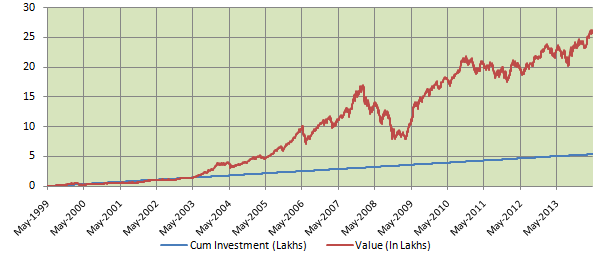
If you had started a monthly SIP of Rs 3000 only in Franklin India Bluechip fund back in May 1999, by now you would have accumulated a corpus of nearly Rs 26 lakhs, with an investment of only Rs 5.4 lakhs. You would have accumulated corpus of Rs 10 lakhs by the end of 2006, a corpus of over Rs 15 lakhs by the end of 2007 and despite the severe financial crisis, a corpus of Rs 20 lakhs by the end of 2010. Over the 15 year period the compounded annual returns on your SIP investment in this fund would be 18.7%.

Birla Sun Life Equity Fund: The Birla Sun Life Equity fund is a diversified equity fund launched in 1998. This fund from the Birla Sun Life stable has an AUM base of nearly Rs 650 crores and is managed by Anil Shah. The fund has been ranked No. 2 by CRISIL in its recent mutual fund ranking for the quarter ending Mar 31, up one place from the ranking for the quarter ending December 31, 2013. The chart below shows the SIP returns of the Birla Sun Life Equity fund, growth option, over the last 15 years.
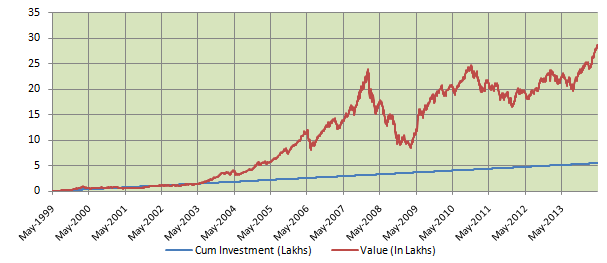
If you had started a monthly SIP of Rs 3000 only in the Birla Sun Life Equity fund back in May 1999, by now you would have accumulated a corpus of over Rs 28 lakhs, with an investment of only Rs 5.4 lakhs. You would have accumulated corpus of Rs 10 lakhs by the end of 2006, a corpus of over Rs 15 lakhs by the end of 2007 and despite the severe financial crisis, a corpus of Rs 20 lakhs around the end of 2009. Over the 15 year period the compounded annual returns on your SIP investment in this fund would be 20%.

Franklin India Prima Plus: The Franklin India Prima Plus fund is a diversified equity fund launched in 1994. This fund from the Franklin Templeton stable has an AUM base of nearly Rs 1990 crores and is managed by R.Janakiraman and Anand Radhakrishnan. The chart below shows the SIP returns of the Franklin India Prima Plus fund, growth option, over the last 15 years.
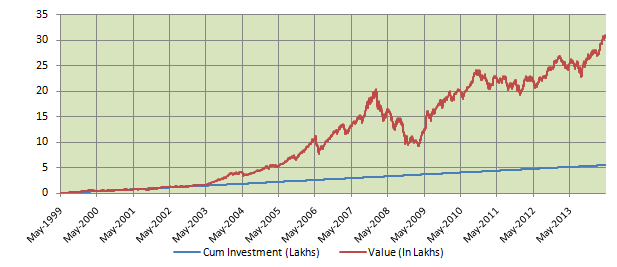
If you had started a monthly SIP of Rs 3000 only in the Franklin India Prima Plus fund back in May 1999, by now you would have accumulated a corpus of nearly Rs 31 lakhs, with an investment of only Rs 5.4 lakhs. You would have accumulated corpus of Rs 10 lakhs by the end of 2006, a corpus of over Rs 15 lakhs by the end of 2007 and despite the severe financial crisis, a corpus of Rs 20 lakhs around the end of 2009. Your corpus would have crossed the Rs 25 lakhs mark by the end of 2012. Over the 15 year period the compounded annual returns on your SIP investment in this fund would be 21%.

HDFC Top 200 Fund: The HDFC top 200 fund, a large cap fund launched in 1996, has for long been a favourite with investors. This fund from India’s largest AMC, has often been proclaimed by many financial planning experts as one of the best ever mutual funds, its current relative under performance notwithstanding. The fund has an AUM base of over Rs 10,000 crores and is managed by Prashant Jain. The chart below shows the SIP returns of the HDFC top 200 fund, growth option, over the last 15 years.
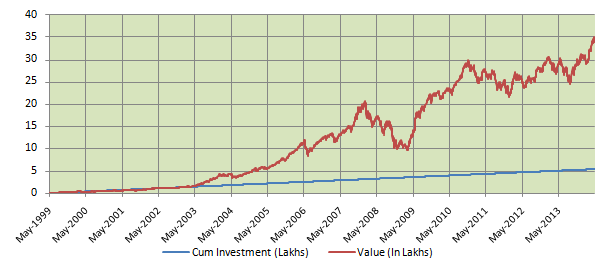
If you had started a monthly SIP of Rs 3000 only in the HDFC top 200 fund back in May 1999, by now you would have accumulated a corpus of nearly Rs 35 lakhs, with an investment of only Rs 5.4 lakhs. You would have accumulated corpus of Rs 10 lakhs by the end of 2006, a corpus of nearly Rs 20 lakhs by the end of 2007. Despite the severe financial crisis, your corpus would have crossed the Rs 30 lakh mark by the end of 2010. Over the 15 year period the compounded annual returns on your SIP investment in this fund would be 22%.

HDFC Equity Fund: The HDFC Equity fund is a diversified equity fund launched in 1994. This fund from India’s largest AMC has an AUM base of nearly Rs 10000 crores and is managed by Prashant Jain. The chart below shows the SIP returns of the HDFC Equity fund, growth option, over the last 15 years.
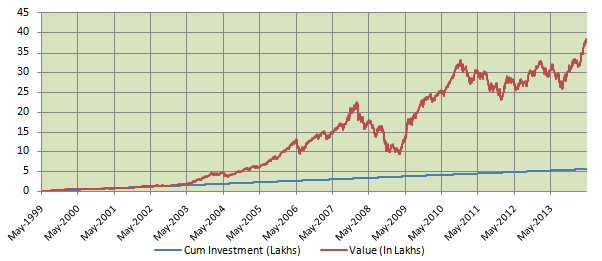
If you had started a monthly SIP of Rs 3000 only in the HDFC Equity fund back in May 1999, by now you would have accumulated a corpus of nearly Rs 38 lakhs, with an investment of only Rs 5.4 lakhs. You would have accumulated corpus of nearly Rs 10 lakhs by the end of 2005, a corpus of nearly Rs 15 lakhs by the end of 2006 and a corpus of Rs 20 lakhs by the end of 2007. Despite the severe financial crisis, your corpus would have hit the Rs 25 lakhs mark by the end of 2009 and crossed Rs 30 lakhs by the end of 2010. Over the 15 year period the compounded annual returns on your SIP investment in this fund would be 23%.
Conclusion: In this article, we have seen how SIPs in large cap and diversified equity funds over the long term have created wealth for the investors. SIPs benefit from the power of compounding, and therefore the earlier we start our SIP, the greater is the potential for wealth creation. However, it is important to select a good fund for our SIPs. Your financial advisers can help you select a good fund that is suitable for your risk profile. As your risk profile changes over time, you should re-balance your portfolio to align with your risk profile. Tomorrow, we will discuss how SIPs in small and midcap funds have created wealth for the investors.

UTI MIS Advantage Fund: One of the best Mutual Fund MIPs for conservative investors

UTI Mutual Fund - Hybrid Debt Oriented Funds
 
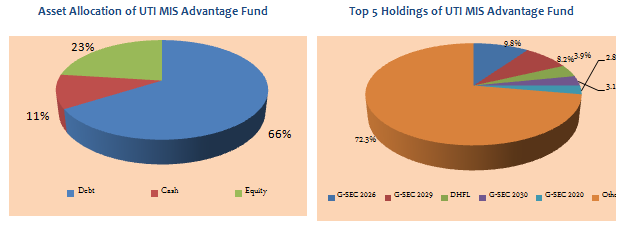
Mutual Fund monthly income plans are debt oriented hybrid funds. Usually a maximum of 25% of the asset allocation goes to equity and the balance to debt. The debt portion of the asset allocation ensures stability of income, while the equity portion provides a kicker to returns by way of capital appreciation. As such Monthly Income Plans have quite limited exposure to market volatility compared to equity oriented funds. UTI MIS Advantage Fund is one of the best mutual fund monthly income plans. Currently 23% of the asset allocation is in equity and the balance is in debt and cash. CRISIL has the highest ranking for this fund in the Monthly Income Plan category and Morningstar has a 4 star rating for this fund.

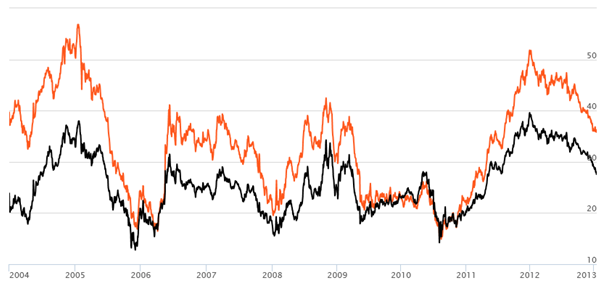
The chart below shows the 3 year rolling returns of UTI MIS Advantage Fund (growth option) since inception. We have chosen 3 years as the rolling return period because investors should have a long investment horizon when investing in Monthly Income Plans. Further, since UTI MIS Advantage Fund is a debt oriented fund the tax treatment is most favourable if the investment holding period is more than 3 years.


Rolling returns are the total returns of a fund taken for a specified period on every day and taken till the last day of the duration. In this chart we are showing 3 year rolling returns on every day from inception of UTI MIS Advantage Fund (orange line) and comparing it with the benchmark, CRISIL MIP Blended Index (black line). Rolling returns is the best measure of a fund's performance. Trailing returns have a recency bias and point to point returns are biased by market conditions during the period in consideration. Rolling returns, on the other hand, measures the fund's absolute and relative performance across all timescales without bias. If you analyze the above chart, you will see that, the fund returns rarely dipped below the benchmark. This is the hallmark of a consistent performer. You will further notice that by and large, the performance gap between the fund and the benchmark has also been consistent. This shows that the fund manager employs a consistent approach and does not take excessive risks. We can make some more interesting observations from the rolling return chart. You can see that the 3 year rolling returns did not dip below 20% (around 6% on an annualized basis) except for a few months over the last 12 years, implying that, if you invested in lump sum in the fund, you could have made withdrawals of 6% of the investment every year and still see substantial capital appreciation of your investment. Approximately 65% of the times, 3 year rolling returns were above 30% (around 9% on an annualized basis). From time to time, the fund gave as high as 40 to 50% 3 year rolling returns (around 12% to 14% on annualized basis). This was the effect of the equity kicker and over a long investment horizon, through the power of compounding will create significant capital appreciation for investors. From the above analysis it is evident that over a long period of time, on an average the UTI MIS Advantage Fund beat the returns given by Post Office Monthly Income scheme. However, investors should remember that mutual funds are subject to market risks and cannot assure returns like Post Office schemes. We spent a fair amount of time analyzing the rolling returns not only to showcase the strong performance of UTI MIS Advantage Fund, but also to help our readers understand the power of Rolling Returns as an analytical tool.
Fund Overview of UTI MIS Advantage Fund

UTI MIS Advantage Fund was launched in December 2003. The scheme has around र 660 crores of Assets under Management with an expense ratio of 1.85%. Amandeep Chopra and Ajay Tyagi are the fund managers of this scheme. Other than growth option, the scheme is open for subscriptions for monthly payment, flexi dividend and monthly dividend options. We will discuss these options later.

UTI MIS Advantage Fund Portfolio
66% of the fund portfolio is invested in fixed income securities, 11% in cash equivalents and 23% in equities. The credit quality of the debt portfolio is excellent. The average maturity of the debt portfolio is 6.6 years, which makes the fund moderately sensitive to interest rate movements. If bond yields harden for a variety of factors, like the impact of Central Government pay increases on the fiscal deficit, rupee depreciation, food price inflation etc, we can see some volatility in NAVs. However, if the long term outlook on interest rates is favourable then good returns can be expected from bonds over a sufficiently long time horizon. The credit quality of the bond portfolio is excellent with 84% of the bond portfolio is rated AAA and 15% rated AA. The equity portfolio has a small bias towards cyclical sectors like banking and finance, metals, capital goods etc, which can give good returns once the capex cycle revives in the economy. However, the equity portfolio is well balanced with substantial allocations to defensive sectors like pharmaceuticals, technology and FMCG. The fund is well diversified from the perspective of company concentration.

Risk and Return of UTI MIS Advantage Fund
In terms of volatility measures, the standard deviation of returns of UTI MIS Advantage Fund is quite low at only 5.1%. In terms of risk adjusted returns, as measured by Sharpe ratio, the fund clearly outperforms average conservative hybrid funds by a big margin.
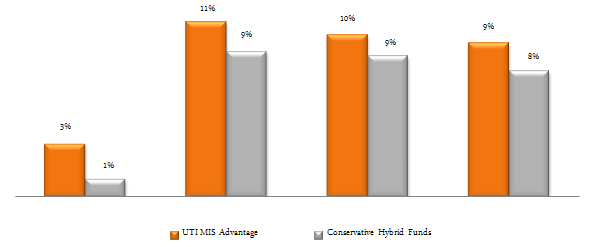
In terms of annualized trailing returns, the fund has beaten average debt oriented hybrid funds across all time-scales since inception.

The chart below shows the annual returns of the UTI MIS Advantage Fund over the last 5 years. Again the fund has outperformed the benchmark and the category in most years.


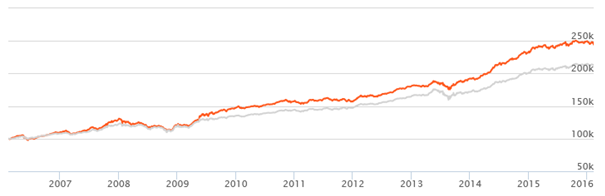
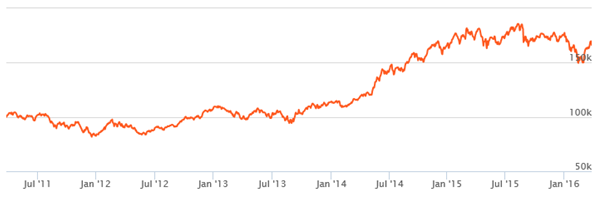
The chart below shows growth of र 1 lac lump sum investment in the UTI MIS Advantage Fund (Growth Option) over the last 10 years. The orange line shows the returns of the fund and the grey line shows the benchmark returns.

Even the SIP return over the past 10 years was quite impressive, considering the conservative risk characteristics of the fund. With a र 5,000 monthly SIP, an investor could have accumulated a corpus of nearly र 10 lacs with a cumulative investment of just र 6 lacs. The orange line shows the returns of the fund and the grey line shows the benchmark returns.


Source: Advisorkhoj

Investment options in UTI MIS Advantage Fund
Investors can select from 4 options:-
Growth Option: The accrued income or profits in the scheme will remain invested and investors will benefit through the power of compounding
Flexi Dividend Option: In this option dividend will be paid from time to time, at the discretion of the fund house
Monthly Dividend Option: In this option, the fund house will endeavour to pay monthly dividends to the investor. However, investors should note that there is no assurance with respect to the dividend amount; neither is there any guarantee that dividends will be paid monthly. Please note that UTI MIS Advantage Fund is a debt fund from a tax perspective. Therefore, dividend distribution tax will be deducted by the fund house before paying dividends to investors.
Monthly Payment Option: In this option the investor can opt to receive monthly payments which UTI Mutual Fund will make by redeeming units of the scheme. This option is very much like Systematic Withdrawal Plan offered by mutual funds. Please note that since the monthly payment is made by redemptions of units, the fund house will not deduct any tax. But since UTI MIS Advantage Fund is a debt fund, the investor will be required to pay short term or long term capital gains tax, depending on the holding period of the units.
Monthly Dividend Pay-out Track Record of UTI MIS Advantage Fund
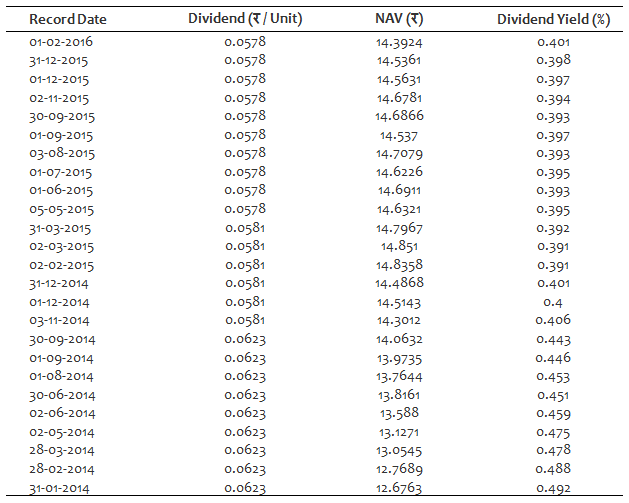
UTI MIS Advantage Fund has an excellent track of making monthly dividend payments. The table below shows the monthly dividend pay-out track record of the scheme over the past two years. You can check the long term dividend pay-out track of the scheme since inception by clicking on the ------> UTI MIS Advantage Fund Monthly Dividend History

The monthly dividend yield has been in the range of approximately 0.4 – 0.5%. The annual dividend yield is therefore in the range of 5 – 6%. You can see that in addition to the monthly dividends the NAV of this option has grown by about 14% in the last 2 years.
Conclusion
UTI MIS Advantage Fund has recently completed 12 years. The fund has a very strong track record and as such is an excellent choice for investors who want both income and some capital appreciation over a long investment horizon. Since the fund has around 25% asset allocation to equity, investors should have tolerance for short term volatility, especially in these market conditions. Investors should discuss with their financial advisors if UTI MIS Advantage Fund is suitable for their investment needs.

DSP BlackRock Opportunities Fund: Consistently top quartile SIP returns in the last 3 to 5 years

DSP BlackRock Mutual Fund - Equity Funds Diversified

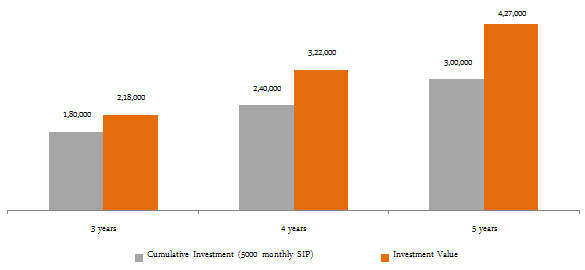
If you had invested र 1 lac in DSP BlackRock Opportunities Fund at the time of its inception (NFO) in the year 2000 the value of your investment today would be र 14 lacs. The performance of this diversified equity fund in the recent years has also been quite consistent. The fund has consistently been in the top quartile, in terms of SIP returns over the last 3 to 5 years. The chart below shows the cumulative investment and current investment value of a र 5,000 monthly SIP in DSP BlackRock Opportunities Fund over the last 3, 4 and 5 years respectively.

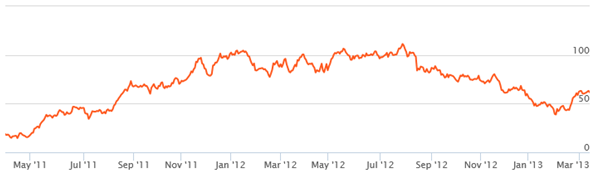
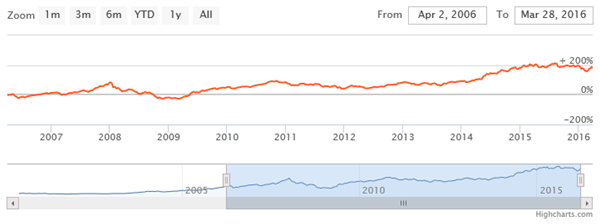
The rolling returns of the DSP BlackRock Opportunities fund showcase the consistent performance of the fund. Rolling returns are the total returns of the scheme taken for a specified period on every day and taken till the last day of the duration. In this chart we are showing the 3 year returns of DSP BlackRock Opportunities fund on every day during the last 5 years.

In this chart you can see that the 3 year rolling returns of the fund was above 50% (14.4% annualized) for nearly 75% of the times over the last 5 years. The last 5 years included 2 bear market periods and two bull market years. The strong 3 year rolling returns given by the fund over the last 5 years is the hallmark of a well managed diversified equity fund.
Fund Overview

DSP BlackRock Opportunities Fund was launched in May 2000. It has र 711 crores of assets under management. The expense ratio of the fund is 2.82% (as on 29-02-2016). The fund manager of this scheme is Rohit Singhania. The chart below shows the NAV movement of DSP BlackRock Opportunities Fund over the last 10 years.


Portfolio Construction
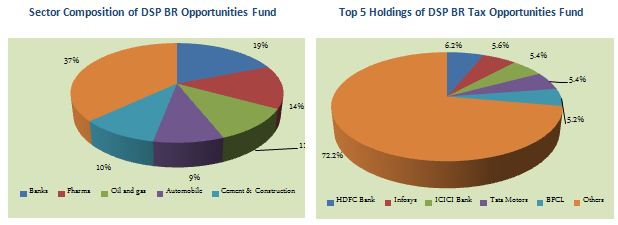
The fund has a large cap, growth oriented focus. The fund manager has a bottoms-up portfolio construction approach. The portfolio is overweight on cyclical sectors like BFSI, Oil & Gas, Automobile & Auto Ancillaries, Cement & Construction etc. To balance its exposure to cyclical, the portfolio also has allocations to defensive sectors, with IT and Pharmaceuticals comprising more than 20% of the portfolio holdings. With cyclical sectors poised to do well with the revival in economic growth and capex cycle, the DSP BlackRock Opportunities Fund has the potential to deliver good returns in the medium and long term. The portfolio is very well diversified in terms of company concentration. The top 5 companies in the fund portfolio, HDFC Bank, Infosys, ICICI Bank, Tata Motors and BPCL account for only 28% of the portfolio value.

Risk and Return
In terms of volatility measures, the standard deviation of monthly returns of DSP Black Rock Opportunities fund is lower than the average standard deviation of monthly returns of diversified equity funds. The Sharpe ratio of the fund is superior to the average Sharpe ratios of the category.
The chart below shows the growth in र 1 lac lump sum investment in DSP BlackRock Opportunities Fund over the last 5 years.


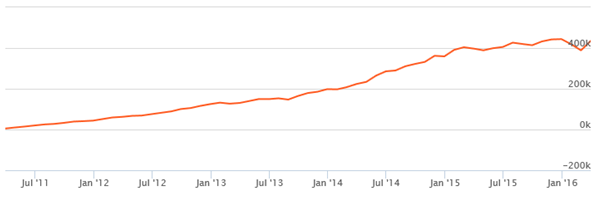
The Systematic Investment Plan returns of the fund over the last 5 years are more impressive. The chart below shows the returns of र 5,000 monthly SIP in DSP BlackRock Opportunities Fund over the last 5 years.


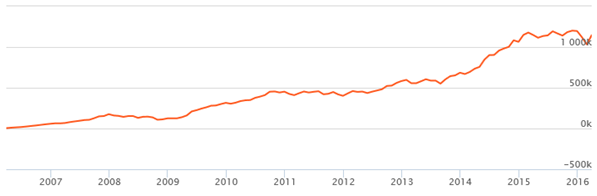
with a cumulative investment र 300,000 you could have accumulated a corpus of र 427,000; a profit of र 127,000 in the last 5 years. If you started your SIP 10 years back, you could have accumulated a corpus of र 11.5 lacs with a cumulative investment of र 6 lacs. This shows the power of SIPs in creating wealth over a long investment horizon.

Source: Advisorkhoj Research
Dividend Pay-Out Track Record
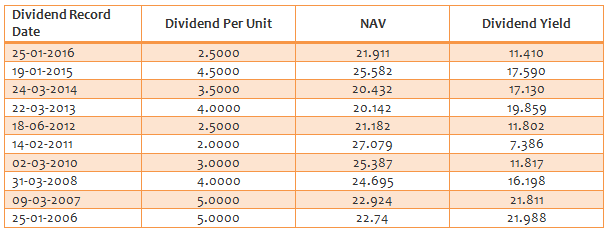
DSP BlackRock Opportunities Fund has a strong dividend pay-out track record. In the last 10 years, the fund paid dividends every year except 2009. You can see in the table below the dividend yields are also quite good.

Conclusion
DSP BlackRock Opportunities Fund has completed nearly 16 years since its launch. The fund has sustained its strong performance track record over the years, despite changes in the fund management. The SIP performance of the fund is especially impressive over the years. The fund also has a good dividend pay-out track record. Investors can consult with their financial advisors if DSP BlackRock Opportunities Fund is suitable for their investment portfolio.